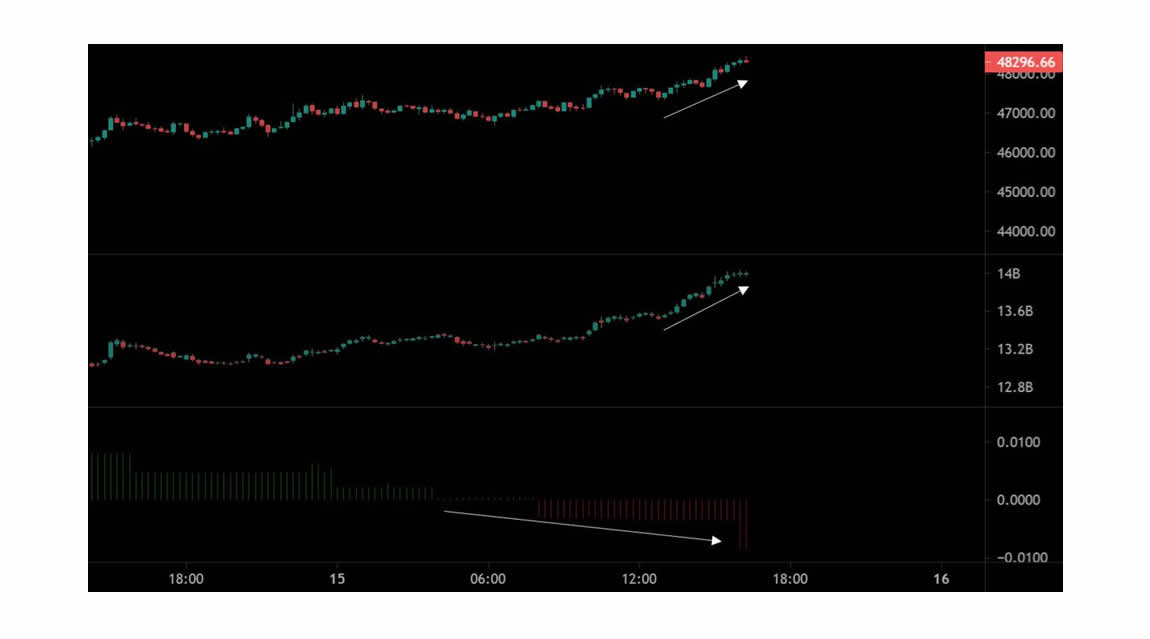
Bitcoin on chain analytics, are showing increased illiquid supply. This means that Bitcoin has increasing inflows, decreasing outflows, and increasing price action. Longer time holders of Bitcoin (older coins) are not selling (Outflow). As long as sell pressure remains low, the price action will keep going up. See the chart below:
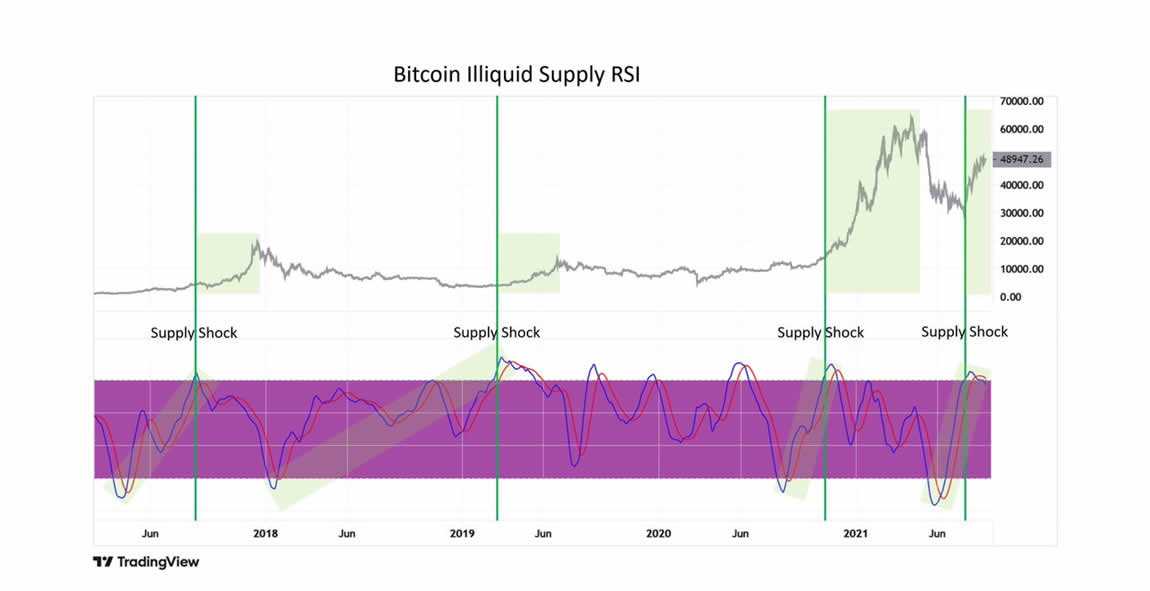
This next chart show illiquid supply compared to RSI (relative strength index). As the RSI climbs and outflows decline, a supply shock ensues. See this chart below:
In the next chart below, stock to flow is combined with illiquid supply to show supply demand on a different chart. Presently, the price floor for Bitcoin is $39K and climbing. Thanks to Will Clemente for these first three charts. He studies onchain analytics and provides fantastic information on this subject: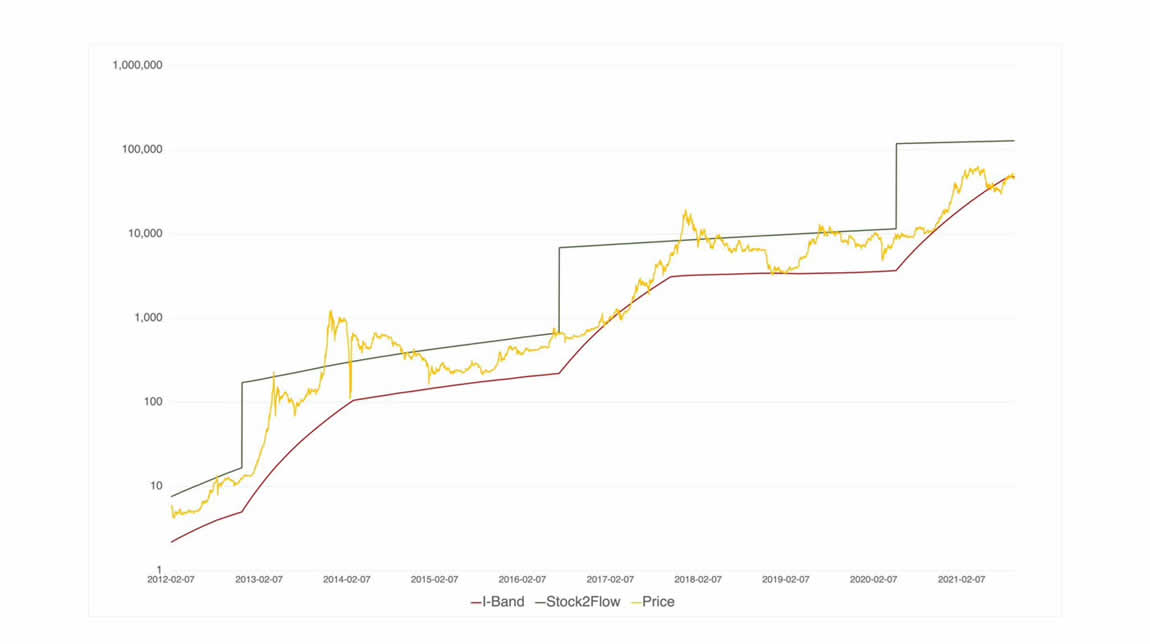
A few weeks ago we were thinking the 200 EMA would top out in the $40K’s somewhere. It is a 200 day moving average, so it would take a long while to move up. These charts are proving what we have been saying all year, that Bitcoin is rhythmic. It takes 18-24 months for the supply shock to mature and bring about the short squeeze. What this means is 18-24 months after the miner reward is cut in half (May 2020), the supply shock will create a parabolic price action in Bitcoin. This parabolic price action squeezes all shorts and makes them financially impossible to pull off for a period of time. Therefore, long range Bitcoin charts show these massive bull run tops which later crash, find a low at the 200 ema (200 day, exponential moving average), then climb back up. The halving date is the beginning of the bull run cycle, or the early stage. The process keeps lengthening each cycle. Therefore, Neutral ATM believes it could be early 2022 until the top is hit. This next chart shows another golden cross whereby the 50 day moving average crosses the 200 day moving average. This happened on Monday and price action is now approaching $48K! See the chart below: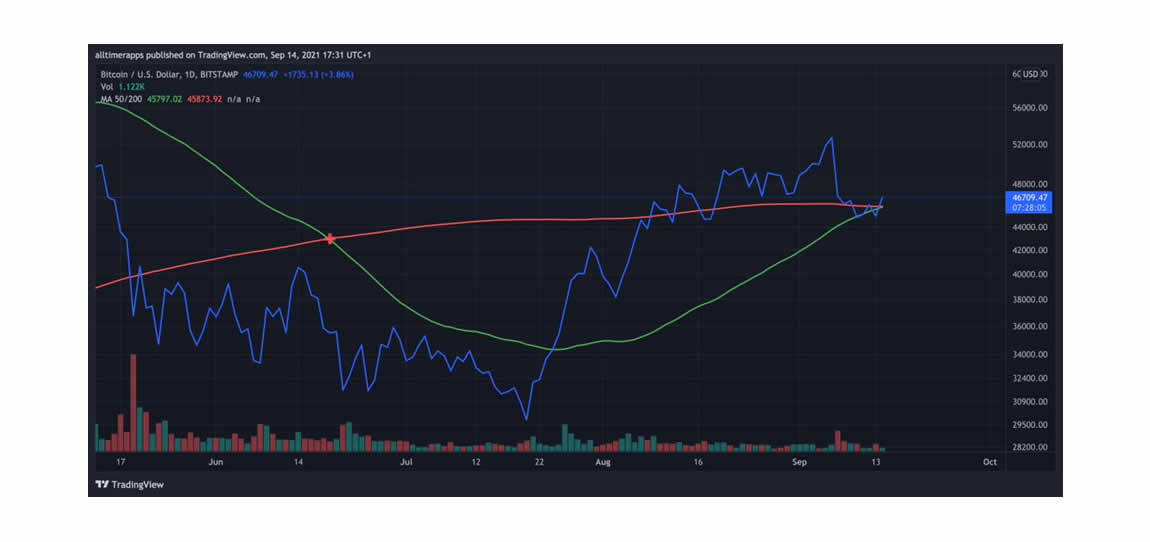
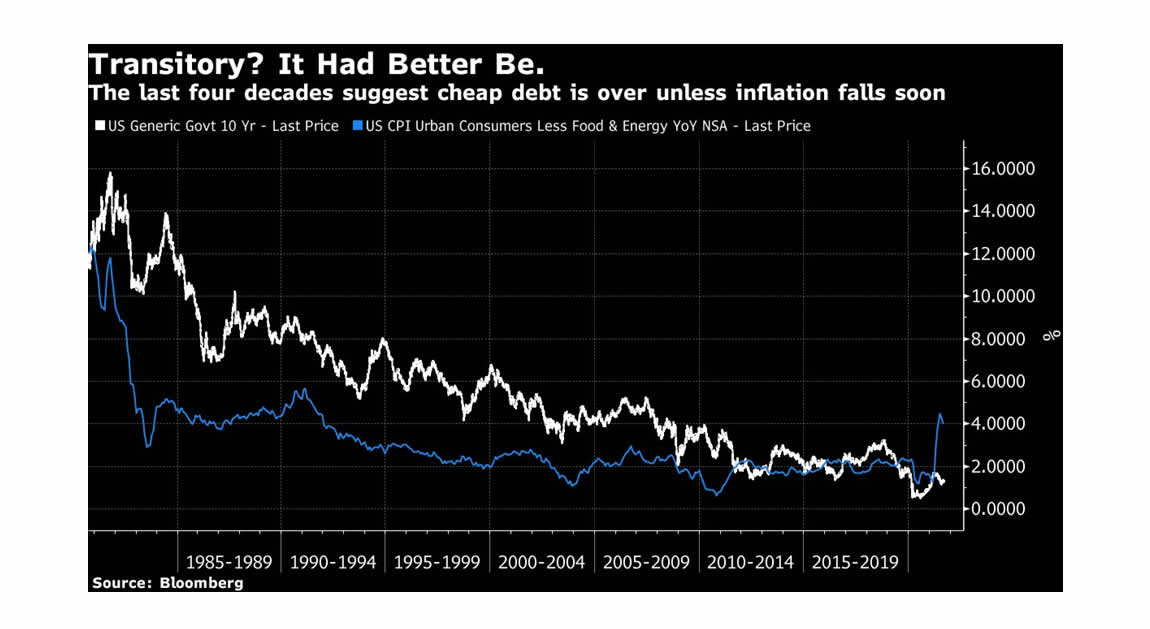
Meanwhile, Christine Legarde the ECB chairman said on Bloomberg that crypto currency is not a currency at all. Well, El Salvador and Ukraine use it as legal tender so they certainly don’t agree. It is irrefutable, that the USD is losing buying power and value at an extremely high rate. Yet, the central banks want us all to look away from the one currency that is remaining scarce, and is deflationary, in that it gains value faster than inflation loses value, on the fiat currency side. Of course that is Bitcoin. This next chart shows the US 10 year bond yield % in white compared to the CPI index in blue. CPI is approaching all time highs while bond yields, are all time lows. If these lines on this chart reverse and bold yields spike up. That signals a deflationary crash, which also requires an investor to hedge. Bitcoin is that hedge. See the chart below:
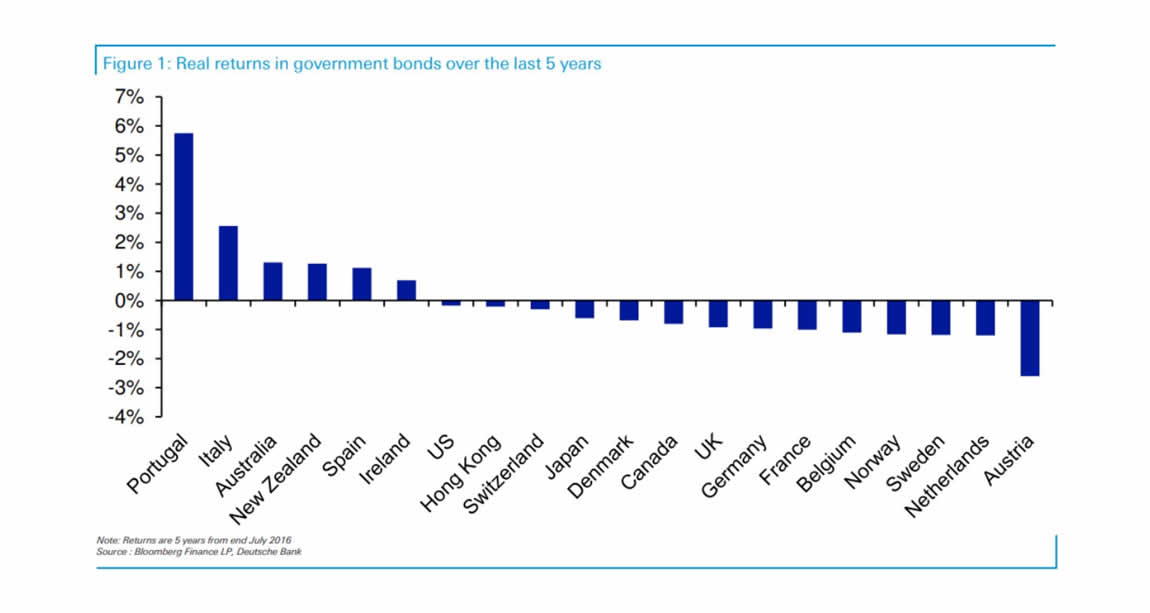
Here is yet another chart, showing countries and their real bond yields, over the last 5 years. US is negative:
Bitcoin will continue to achieve returns that far surpass inflation, bond yields, stock market returns. As long as central banks have to print like this, and for the foreseeable future, we know they will. Bitcoin will return outsized ROI’s. Hold Bitcoin and protect your wealth.
“Bitcoin is getting investors scarcity, decentralization, and security during a decade of rampant money supply inflation, totalitarian central control, and security hacks!”
Neutral ATM buys and sells Bitcoin as little as $20 at a time! You do NOT have to buy an entire Bitcoin. Neutral ATM is here to get everyone off of zero Bitcoin.
Give Neutral ATM a try. We have low rates, convenient locations and we are expanding. Contact Neutral ATM, we will answer all your questions about Bitcoin and using our ATM machines. Find a Neutral ATM Bitcoin machine location near you.
